September Stock Market Outlook 2026: Why This Month Is Historically the Worst for Stocks
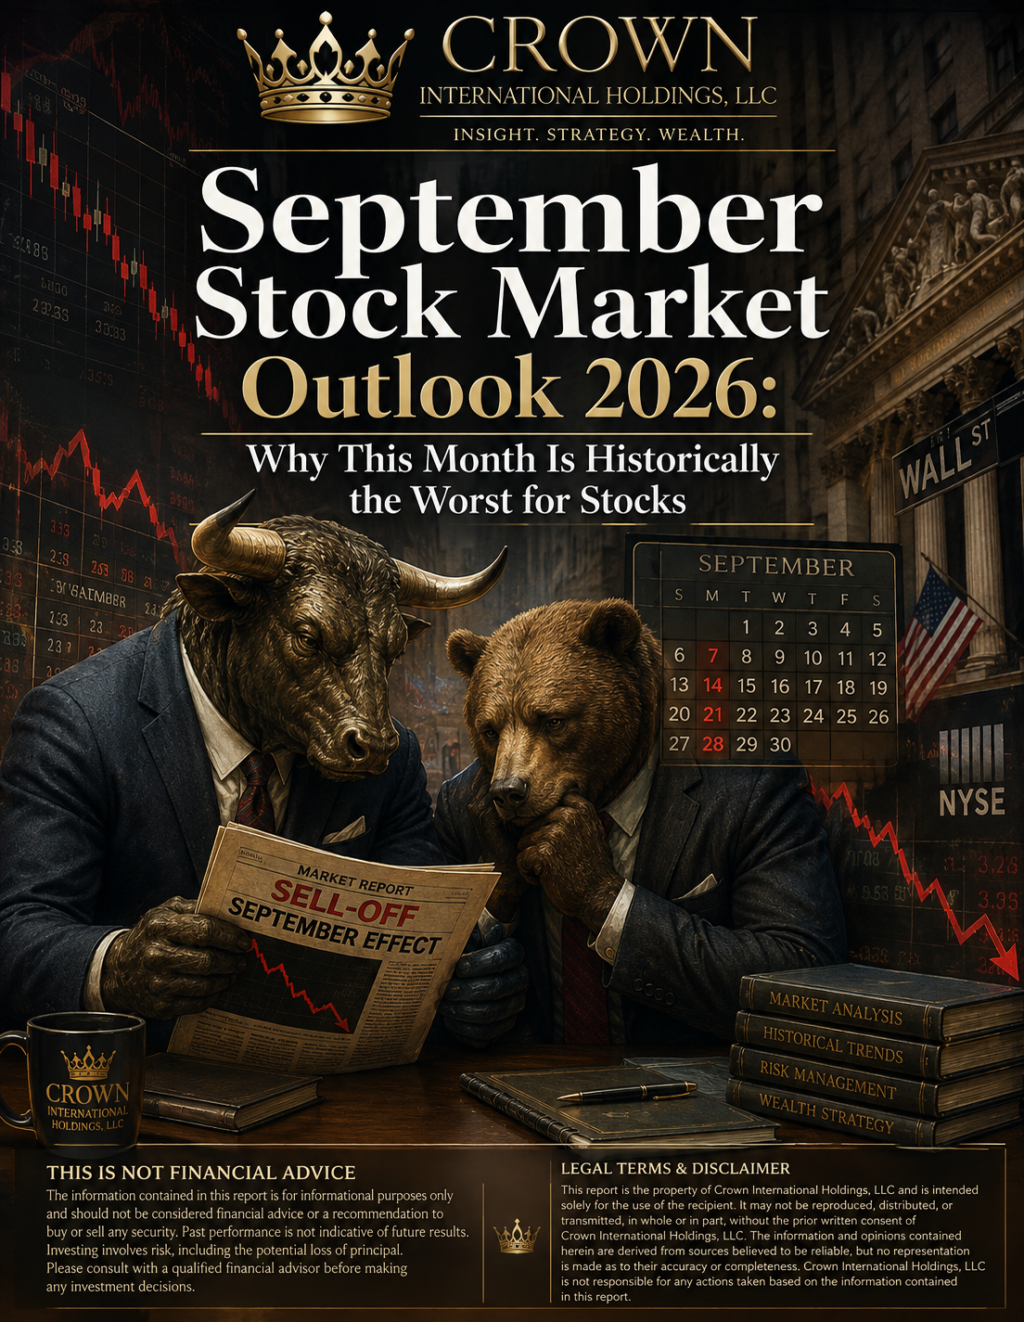
September Stock Market Outlook 2026: Why This Month Is Historically the Worst for Stocks
By Crown International Holdings, LLC
September has arrived, and for many investors, that means one thing: it is time to brace for volatility.
While October is famously known for market crashes—think 1929, 1987, and 2008—it is September that holds the unenviable title of being the worst-performing month for U.S. stocks over the past seven decades. As the S&P 500 enters September 2026 fresh off a strong summer rally, market watchers are asking a critical question: Will history repeat itself?
Whether you are a day trader, a retirement saver, or a portfolio manager, understanding the seasonal patterns that drive September stock market performance is essential for navigating the weeks ahead. This article breaks down the historical data, the structural reasons behind the weakness, the 2026 outlook, and actionable strategies to protect your investments.
The Historical Record: September’s Grim Track Record
When analysts examine historical stock market returns by month, one number stands out for all the wrong reasons. September is the only month that has consistently delivered negative average returns over multi-decade periods.
Since 1950, the benchmark S&P 500 has recorded an average decline of -0.7% during September. This weakness is not confined to the S&P 500; major indices have historically bled red across the board:
| Index | Average September Decline | Period Covered |
|---|---|---|
| Dow Jones Industrial Average | -0.8% | Since 1950 |
| Nasdaq Composite | -0.9% | Since 1971 |
| Russell 2000 (Small-Cap) | -0.8% | Since 1979 |
Key Takeaway: September is statistically the worst month for stocks. However, the pattern has moderated in recent decades, with some analysts attributing this to investors “front-running” the weakness by selling in August.
September vs. Other Months: How Does It Compare?
To put September’s performance into perspective, consider this:
- November is historically the best month, averaging a +1.82% gain.
- April and December also rank among the strongest months.
- September stands alone as the only month with a consistent negative average.
This stark contrast makes September a critical month for seasonal investing strategies.
Why Does September Perform So Poorly?
The September slump is not merely a statistical quirk. Several structural and behavioral factors converge during this month to create a challenging environment for equities.
1. Institutional Portfolio Restructuring
As the third quarter draws to a close, large institutional investors—including mutual funds, hedge funds, and pension funds—must prepare their quarterly reports. This often triggers window dressing, where managers sell underperforming assets to clean up their books. The resulting wave of selling pressure can weigh heavily on stock prices.
2. Tax-Loss Harvesting
September also marks a key period for tax-loss harvesting, particularly among institutional accounts that align with the calendar fiscal year. By realizing losses before the quarter ends, fund managers can offset capital gains elsewhere, further adding to the month’s selling volume.
3. Post-Summer Trading Dynamics
After the slower, lower-volume trading days of July and August—when many traders and fund managers are on vacation—September brings an abrupt return to full activity. This seasonal lull can leave markets vulnerable to sharp moves, especially when economic data or geopolitical events hit the tape.
4. End-of-Quarter Rebalancing
Large institutional portfolios often rebalance their asset allocations at the end of each quarter. If equities have outperformed other asset classes during the summer, this rebalancing can involve selling stocks and buying bonds, contributing to the downward pressure.
5. Psychological Factors
There is also a psychological component. Investors are aware of September’s historical weakness, which can create a self-fulfilling prophecy. Nervous traders may preemptively sell, accelerating the decline and reinforcing the pattern.
The 2026 Factor: A Warning Sign for This Year
While historical patterns are always worth monitoring, the September 2026 landscape carries a unique characteristic that could make this year’s seasonal weakness even more pronounced.
The Strong Summer Rally Effect
A long-standing observation in market analysis is that a strong summer rally often increases the risk of a sharper fall correction. When the S&P 500 gains more than 2% in both July and August, the subsequent September tends to be particularly harsh.
- In those specific scenarios, the average September decline has widened to approximately -1%.
- Negative Septembers occurred in roughly 8 out of every 11 instances when the summer rally was particularly strong.
This is directly relevant to 2026. The S&P 500 finished August with a solid 2.62% gain, setting the stage for a potential seasonal pullback. While no one can predict with certainty, the historical odds suggest that investors should brace for elevated volatility as September unfolds.
Election Year Dynamics
It is also worth noting that 2026 is a midterm election year. Historically, midterm years have been the weakest of the four-year presidential cycle, with September often being the most volatile month of those years. However, the post-election period—particularly November—has historically been a strong catalyst for a year-end rally.
Key Insight: September weakness in 2026 could present a buying opportunity for investors with a longer time horizon.
Best and Worst Sectors to Watch in September
Not all stocks move in the same direction during a seasonal downturn. Historical data reveals clear patterns in how different sectors tend to perform during September.
Sectors That Typically Underperform
| Sector | Why It Struggles |
|---|---|
| Technology | High-beta tech stocks are often hit hardest during broad market selloffs, as investors rotate out of growth names and into safety. |
| Consumer Discretionary | This cyclical sector tends to decline alongside broader market weakness, as consumer spending concerns weigh on sentiment. |
| Industrials | With exposure to economic cycles, industrials can be vulnerable to risk-off sentiment. |
Sectors That Typically Hold Up Better
| Sector | Why It Outperforms |
|---|---|
| Healthcare | Defensive by nature, healthcare stocks often provide a safe haven during periods of market stress. |
| Consumer Staples | Products like food, beverages, and household goods see steady demand regardless of the economic cycle, making this sector a classic defensive play. |
| Utilities | With stable earnings and reliable dividends, utilities are another traditional safe harbor during market turbulence. |
Pro Tip: Investors looking to hedge against September weakness may consider rotating into defensive sectors or increasing cash reserves ahead of potential volatility.
What This Means for Investors
So, how should you position yourself in light of September’s historical weakness? The answer depends on your investment horizon, risk tolerance, and overall financial goals.
🔹 For Short-Term Traders
- Reduce exposure to high-beta sectors that are historically sensitive during seasonal selloffs, such as Technology and Consumer Discretionary.
- Look to defensive sectors like Healthcare, Consumer Staples, and Utilities, which tend to hold up better.
- Consider cash positions to preserve capital and take advantage of potential buying opportunities.
- Use stop-loss orders to protect gains and limit downside risk.
🔹 For Long-Term Investors
- Avoid panic-driven decisions based solely on seasonal patterns. A historically weak month is not a reason to abandon a well-constructed portfolio.
- Consider deploying cash gradually into the weakness, averaging into positions rather than trying to time the absolute bottom.
- Keep a long-term perspective. September is historically followed by October (which has a mixed record) and then by November—statistically the strongest month of the year.
- Review your asset allocation to ensure it aligns with your long-term goals and risk tolerance.
🔹 For Risk-Management Focused Investors
- Review your portfolio’s overall risk exposure and ensure proper diversification across asset classes.
- Consider options strategies, such as protective puts, to hedge against downside risk.
- Monitor key support levels on major indices and set price alerts for critical technical levels.
- Rebalance periodically to maintain your target allocation, especially after a strong summer rally.
Frequently Asked Questions
Is September always a losing month for stocks?
No. While September has a negative average return, it does not decline every year. In fact, the S&P 500 has finished September positive in several recent years. Historical patterns are guides, not guarantees.
Should I sell all my stocks in September?
No. Selling all your stocks based solely on seasonal patterns is rarely a sound investment strategy. Instead, consider tactical adjustments, such as increasing defensive sector exposure or adding hedges.
What sectors perform best in September?
Historically, defensive sectors like Healthcare, Consumer Staples, and Utilities tend to hold up better during September weakness. These sectors offer stable earnings and reliable dividends.
How does September 2026 compare to previous years?
September 2026 follows a particularly strong summer rally, with the S&P 500 gaining 2.62% in August. Historical data suggests that strong summer performance often amplifies the September decline.
The Bottom Line: Brace for Volatility, But Don’t Panic
September has earned its reputation as Wall Street’s most challenging month, backed by decades of historical data. Institutional selling pressure, tax-related portfolio adjustments, post-summer trading dynamics, and psychological factors all converge to create a historically bearish environment.
For 2026, the risks may be amplified by a strong summer run-up, suggesting that patience and caution could be the smartest strategies for the weeks ahead. However, as with all seasonal patterns, the data is a guide, not a guarantee. Economic fundamentals, Federal Reserve policy, corporate earnings, and geopolitical developments will ultimately determine the market’s path.
Smart investors know the history—but they also know that every year writes a new chapter. Stay diversified, stay disciplined, and keep your eyes on the long-term horizon.
Key Takeaways
| Aspect | Key Insight |
|---|---|
| Historical Performance | September averages a -0.7% decline for the S&P 500 since 1950. |
| Why September Struggles | Institutional selling, tax-loss harvesting, post-summer trading dynamics, and psychological factors. |
| 2026 Outlook | A strong summer rally (S&P 500 +2.62% in August) may amplify the seasonal weakness. |
| Defensive Sectors | Healthcare, Consumer Staples, and Utilities tend to hold up best. |
| Investor Strategy | Stay diversified, avoid panic, and consider buying opportunities on weakness. |
Disclaimer: This article is for informational and educational purposes only and does not constitute financial advice. Past performance does not guarantee future results. Always consult with a qualified financial advisor before making investment decisions.