Weekly Market Roundup: Stocks, Forex, Commodities, Ags & Crypto – Full Review for Sep 7 – Sep 11, 2026

Weekly Market Roundup: Stocks, Forex, Commodities, Ags & Crypto – Full Review for Sep 7 – Sep 11, 2026

Wall Street Weekly Review: Oil Shock Meets Inflation Data as Stocks Stumble Into Fed Week (Sep 7 – Sep 11, 2026)
U.S. stock market analysis: Dow Jones, S&P 500, Nasdaq, and Russell 2000 performance, plus the inflation shock, oil spike, and Fed rate hike odds ahead of the September FOMC meeting.
The second week of September delivered a brutal combination for equity markets: surging oil prices, hotter-than-expected inflation data, and mounting expectations for a Federal Reserve rate hike. What began as a tentative recovery attempt quickly reversed as Brent crude crossed $100 per barrel for the first time since July and the August CPI report showed inflation reaccelerating.
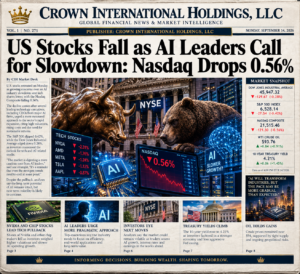
The result was another negative week across major indices, with the S&P 500 and Nasdaq extending their September declines. Monday’s Labor Day holiday shortened the trading week, but the compressed schedule did nothing to ease the selling pressure.
Major Index Performance: Another Week of Losses
Here’s how the four major U.S. stock indices performed for the week ending September 11, 2026:
| Index | Weekly Change | Key Takeaway |
|---|---|---|
| Dow Jones Industrial Average | -1.4% | Energy strength couldn’t offset broad weakness |
| S&P 500 | -1.8% | Inflation data dashed rate-cut hopes |
| Nasdaq Composite | -2.3% | Tech pummeled by rising yields and AI financing concerns |
| Russell 2000 | -2.5% | Small caps crushed by rate hike expectations |
The Oil Shock Arrives
The week’s dominant macro story was the dramatic surge in crude oil prices. Brent crude climbed above $100 per barrel on Wednesday as US-Iran tensions escalated in the Strait of Hormuz, with reports of Iranian-backed Houthi strikes on Saudi cities and US forces targeting Iranian oil tankers.
The energy sector was the lone bright spot, but even that couldn’t save the broader market. The message from oil’s surge was clear: higher input costs, renewed inflation pressure, and a more aggressive Fed.
CPI Report: Inflation Reaccelerates
Friday’s CPI report confirmed the market’s worst fears. The Consumer Price Index rose 0.4% in August, up sharply from July’s 0.1% gain, with the annual rate holding at 3.4%. Core CPI rose 0.3% month-over-month, above expectations of 0.2%.
Gasoline prices led the increase, surging 3.9% for the month and accounting for more than one-third of the overall CPI gain. The inflation report arrived just days before the Fed’s September 15-16 policy meeting, cementing expectations for another rate hike.
The Yield Spiral Continues
The 10-year Treasury yield pushed above 4.8% following the PPI report earlier in the week, reaching its highest level since November 2023. The surge in yields reflected both the inflation data and the oil price shock, which together suggested the Fed would need to maintain its hawkish stance.
Key Developments:
- PPI Surprise: August PPI rose 5.4% year-over-year, above expectations of 5.3% and July’s revised 4.8%
- Fed Pricing: Markets now price a 62-70% probability of a September rate hike
- Treasury Pressure: AI-related corporate bond issuance continues to compete with Treasuries for capital, pushing yields higher
Fed Meeting Preview: What to Expect
With the Fed’s September 15-16 meeting looming, markets are positioning for a potential 25-basis-point hike that would take the target range to 3.75%-4.00%.
Key Questions:
- Will the Fed signal further hikes ahead?
- How will Chair Warsh balance inflation concerns against growth risks?
- What does the dot plot reveal about the path forward?
Sector Performance: Energy Stands Alone Again
| Sector | Weekly Change | Notes |
|---|---|---|
| Energy | +3.2% | Oil surge drives outperformance |
| Utilities | -0.8% | Defensive but rate-sensitive |
| Healthcare | -1.1% | Modest decline |
| Technology | -2.8% | AI trade continues to unwind |
| Real Estate | -2.6% | Higher yields crush REITs |
| Consumer Discretionary | -2.2% | Inflation squeezes spending |
Final Takeaway for Investors
September is living up to its reputation as the worst month for stocks. The combination of surging oil, reaccelerating inflation, and a Fed poised to hike has created a perfect storm for risk assets.
Bullish Signals:
- Energy sector strength suggests the economy remains resilient
- Corporate buybacks may provide support at lower levels
- A hawkish Fed could eventually bring inflation under control
Bearish Signals:
- Oil above $100 threatens corporate margins and consumer spending
- Rate hike expectations are rising, not falling
- The AI trade that carried markets in 2025 continues to unwind
- Small-cap weakness signals economic fragility ahead

Weekly Forex Review: Dollar Slides Despite Yield Surge as Yen Surges on BOJ Expectations (Sep 7 – Sep 11, 2026)
The dollar index falls toward 96.8 as traders look past higher US yields, focusing instead on ECB tightening and BOJ normalization. The yen posts its best week since February.
The dollar suffered a surprising decline this week, falling approximately 0.4% despite the 10-year Treasury yield holding above 5%. The divergence between yields and the dollar suggested traders were focused on other factors: the ECB’s expected rate hike, the BOJ’s imminent tightening, and the broader repricing of global rate differentials.
The U.S. Dollar Index (DXY) closed the week near 96.8, its lowest level in nearly two weeks.
🇺🇸 U.S. Dollar (USD): Yields Up, Dollar Down
The greenback’s inability to rally despite surging yields was the week’s most puzzling story.
What Happened:
- The 10-year Treasury yield held above 5% throughout the week
- The 2-year yield climbed as markets priced a September Fed hike
- Yet the DXY still declined
Why the Dollar Struggled:
- The ECB is expected to hike by 25 basis points in September, narrowing the rate differential
- Japanese investors may repatriate funds to support the yen, weighing on dollar-denominated assets
- Speculative accounts remain net short the dollar for a sixth consecutive week
🇪🇺 Euro (EUR): Holding Firm Above 1.1000
The euro maintained its recent strength, holding above the 1.1000 level against the dollar.
Weekly Snapshot:
| Metric | Value |
|---|---|
| Closing Rate (EUR/USD) | ~1.1015 |
| Weekly Change | +0.4% |
| Key Support | 1.0920 (50-day MA) |
| Key Resistance | 1.1100 |
Drivers of Euro Strength:
- ECB rate hike expectations around 70% for September
- Eurozone services inflation remains sticky near 3.5%
- The rate differential with the U.S. is narrowing
🇬🇧 British Pound (GBP): Tracking Euro Higher
Sterling followed the euro’s lead, holding above the 1.2700 level.
Weekly Snapshot:
| Metric | Value |
|---|---|
| Closing Rate (GBP/USD) | ~1.2750 |
| Weekly Change | +0.3% |
| Key Support | 1.2640 (50-day MA) |
| Key Resistance | 1.2850 |
🇯🇵 Japanese Yen (JPY): The Star Performer
The yen delivered its strongest weekly performance since February, surging over 4% against the dollar as expectations for BOJ tightening intensified.
Weekly Snapshot:
| Metric | Value |
|---|---|
| Closing Rate (USD/JPY) | ~153.65 |
| Weekly Change | -4.0% vs. USD |
| Key Support | 152.50 |
| Key Resistance | 156.00 |
The Yen Rally Drivers:
- BOJ expected to hike 25 basis points at its September 17-18 meeting
- Japanese investors repatriating overseas funds
- Washington pressure for a stronger yen
- The unwinding of popular carry trades
“Fair value for the yen is in the 140s in our estimation,” said Aninda Mitra, head of Asia macro strategy at BNY Investments.
🇨🇳 Chinese Yuan (CNY): Stable Amid Dollar Weakness
The yuan held steady as the dollar’s broad decline offset China’s softer economic data.
Weekly Snapshot:
| Metric | Value |
|---|---|
| Central Parity Rate | $1 = 6.7850 yuan |
| Weekly Change | +0.1% vs. USD |
Weekly Exchange Rate Recap
| Currency Pair | Sep 4 Close | Sep 11 Close | Weekly Change |
|---|---|---|---|
| EUR/USD | $1.0970 | $1.1015 | +0.4% |
| GBP/USD | $1.2710 | $1.2750 | +0.3% |
| USD/JPY | ¥160.50 | ¥153.65 | -4.0% |
| DXY | 98.15 | 96.80 | -0.4% |
Looking Ahead: Key Themes for FX Markets
- Fed Meeting (Sep 15-16): A hike is likely, but the dot plot matters more
- BOJ Meeting (Sep 17-18): A hike could extend the yen’s rally
- ECB Meeting: Expected to hike, supporting the euro
- Intervention Watch: The yen’s rapid rise reduces intervention risk
Bottom Line for Forex Traders
The dollar’s unusual weakness despite higher yields suggests the market is looking beyond the Fed to other central banks. The ECB and BOJ are both expected to tighten, narrowing rate differentials that had favored the dollar. The yen’s surge represents a significant shift in carry trade dynamics and could have far-reaching implications for global capital flows.

Commodities Weekly Review: Oil Breaches $100 as Gold Rebounds, Metals Diverge (Sep 7 – Sep 11, 2026)
Crude oil surges past $100 on Middle East escalation while gold finds its footing after recent selling. Copper stabilizes, agricultural commodities show mixed performance.
Commodity markets were dominated by the oil price surge this week, with Brent crude crossing $100 per barrel for the first time since July. Precious metals found support from safe-haven demand despite rising yields, while industrial metals and agricultural commodities traded mixed.
Crude Oil: The $100 Breach
Oil prices surged to three-month highs as US-Iran tensions escalated dramatically.
Weekly Performance Snapshot:
| Benchmark | Price (Sep 11) | Weekly Change | Key Driver |
|---|---|---|---|
| Brent Crude | ~$100.50 | +11.4% | Iran tensions, Hormuz disruption fears |
| WTI Crude | ~$95.20 | +12.3% | Supply concerns intensify |
The Escalation:
- Iranian-backed Houthis launched strikes on Saudi cities
- US forces hit multiple Iranian oil tankers
- Iran targeted a US base in Jordan
- Iran announced new shipping corridor requiring vessels to coordinate with Tehran
Key Levels to Watch:
| Brent | WTI |
|---|---|
| Support: $97.00 | Support: $92.00 |
| Resistance: $105.00 | Resistance: $100.00 |
Gold: Finding a Floor
Gold rebounded from recent losses, gaining ground as safe-haven demand offset the pressure from rising yields.
Weekly Performance Snapshot:
| Metal | Price (Sep 11) | Weekly Change | Notes |
|---|---|---|---|
| Gold (spot) | ~$4,420 | +1.8% | Rebound after three down weeks |
| Gold (futures) | ~$4,440 | +1.5% | Testing resistance |
The Competing Forces:
- Supportive: Geopolitical uncertainty, safe-haven demand, weaker dollar
- Pressuring: Rising real yields, Fed hike expectations, stronger-than-expected jobs data
“Wednesday has shown that the haven trade can still assert itself,” noted one analyst. “It has not shown that the inflation and rate channels have disappeared”.
Key Levels:
| Level | Price | Significance |
|---|---|---|
| Support | $4,350 | 52-week low |
| Support | $4,400 | Psychological level |
| Resistance | $4,500 | Former support |
| Resistance | $4,641 | 200-day MA |
Silver, Platinum, Palladium: Tracking Gold
| Metal | Price (Sep 11) | Weekly Change |
|---|---|---|
| Silver | ~$69.50 | +2.2% |
| Platinum | ~$1,870 | +1.9% |
| Palladium | ~$1,345 | +1.9% |
Industrial Metals: Copper Stabilizes
Copper held steady after recent volatility, supported by supply concerns and China stimulus hopes.
Weekly Performance Snapshot:
| Metric | Value |
|---|---|
| Price | ~$9,520/tonne |
| Weekly Change | +0.7% |
| Support | $9,300 |
| Resistance | $9,700 |
Commodity Price Recap
| Commodity | Price (Sep 11) | Weekly Change | Theme |
|---|---|---|---|
| Brent Crude | ~$100.50 | +11.4% | Geopolitical surge |
| WTI Crude | ~$95.20 | +12.3% | Supply fears |
| Gold (spot) | ~$4,420 | +1.8% | Safe-haven rebound |
| Silver | ~$69.50 | +2.2% | Following gold |
| Copper | ~$9,520 | +0.7% | Stabilizing |
The Week Ahead: Three Things to Watch
- Fed Meeting: Rate decision and dot plot will impact all commodities
- OPEC+ Response: Will producers react to $100 oil?
- China Data: Industrial production and retail sales could move base metals
Bottom Line for Commodities Investors
The oil market has entered a new phase, with geopolitical risk premium driving prices above $100. Whether this sustains depends on the trajectory of US-Iran tensions. Gold’s rebound suggests safe-haven demand remains alive despite the Fed’s hawkish stance. Industrial metals remain caught between supply constraints and global growth concerns.

Grains & Livestock Weekly Review: Corn and Soybeans Slip, Wheat Holds Gains, Cattle Pressured (Sep 7 – Sep 11, 2026)
Grains retreat as harvest approaches and the dollar weakens. Wheat consolidates after recent surge. Cattle markets face pressure from feed costs and processing margins.
Agricultural markets traded mostly lower this week, with corn and soybeans giving back recent gains as harvest pressure emerged. Wheat held most of its recent rally, while livestock markets faced headwinds from elevated feed costs.
Corn: Harvest Pressure Emerges
Corn futures slipped as the approaching harvest created seasonal selling pressure.
Weekly Performance Snapshot:
| Benchmark | Sep 4 Price | Sep 11 Price | Weekly Change |
|---|---|---|---|
| CBOT Corn | $5.355/bushel | $5.28/bushel | -1.4% |
Market Dynamics:
Bearish Factors:
- Harvest approaching, creating seasonal selling pressure
- Feed demand concerns amid livestock sector weakness
- Technical selling after recent rally
Bullish Factors:
- Lower crop condition ratings
- Strong export demand
- Weaker dollar supports U.S. competitiveness
Key Levels:
| Level | Price |
|---|---|
| Support | $5.15 |
| Resistance | $5.45 |
Soybeans: Following Corn Lower
Soybean futures declined alongside corn, pressured by harvest expectations and weak soybean oil prices.
Weekly Performance Snapshot:
| Benchmark | Sep 4 Price | Sep 11 Price | Weekly Change |
|---|---|---|---|
| CBOT Soybeans | $12.85/bushel | $12.62/bushel | -1.8% |
What’s Driving the Market:
Bearish Factors:
- Record Brazilian production expected
- Harvest pressure approaching
- Soybean oil weakness on biodiesel margin concerns
Bullish Factors:
- Strong domestic crush demand
- South American planting weather concerns
- Weaker dollar
Wheat: Holding Recent Gains
Wheat futures consolidated after last week’s 5.1% surge, holding above $6.00 per bushel.
Weekly Performance Snapshot:
| Benchmark | Sep 4 Price | Sep 11 Price | Weekly Change |
|---|---|---|---|
| CBOT Wheat | $6.15/bushel | $6.08/bushel | -1.1% |
Market Context:
- Weather concerns in Russian wheat belt persist
- Australian growing areas remain dry
- Black Sea shipping uncertainty continues
Cattle & Calves: Under Pressure
Cattle markets declined as elevated feed costs and processing margin pressure weighed on prices.
Weekly Performance Snapshot:
| Benchmark | Price (Sep 11) | Weekly Change | Notes |
|---|---|---|---|
| Live Cattle (Oct) | ~$2.19/lb | -1.8% | Testing support |
| Feeder Cattle | ~$329.50 | -1.8% | Feed cost pressure |
Key Levels:
- Live Cattle Support: $2.15/lb
- Live Cattle Resistance: $2.25/lb
Dairy (Class III Milk): Slight Decline
| Benchmark | Price (Sep 11) | Weekly Change |
|---|---|---|
| Class III Milk (Sep) | ~$16.22/cwt | -0.8% |
Broilers (Poultry): Divergence Continues
| Product | Weekly Trend | Notes |
|---|---|---|
| Eggs | +1.5% | Continued tight supply |
| Chicken | -0.5% | Soft demand |
Agricultural Price Recap
| Commodity | Price (Sep 11) | Weekly Change |
|---|---|---|
| Corn | $5.28/bushel | -1.4% |
| Soybeans | $12.62/bushel | -1.8% |
| Wheat | $6.08/bushel | -1.1% |
| Live Cattle | ~$2.19/lb | -1.8% |
| Class III Milk | ~$16.22/cwt | -0.8% |
The Week Ahead: Three Things to Watch
- Harvest Progress: Early yield reports will shape price direction
- USDA Reports: Weekly export sales and crop progress data
- South American Weather: Planting season conditions in Brazil and Argentina
Bottom Line for Ag Investors
Grains are entering the harvest season with prices under pressure from seasonal selling and expectations of large crops. Wheat remains the relative bright spot on global weather concerns. Livestock markets face a challenging environment with elevated feed costs and uncertain demand.

Crypto Weekly Review: Bitcoin Tumbles Below $77,000 as PPI Shock Triggers Liquidations (Sep 7 – Sep 11, 2026)
The crypto market suffers a sharp reversal as hot PPI data and surging Treasury yields trigger massive liquidations. Bitcoin drops below $77,000, while altcoins post steep declines.
The cryptocurrency market’s two-week rally came to an abrupt halt this week, as the combination of hotter-than-expected inflation data and surging Treasury yields triggered a cascade of liquidations. Bitcoin fell below $77,000, while altcoins suffered even steeper losses.
Weekly Performance Summary
| Asset | Price (Sep 11) | Weekly Change | Notes |
|---|---|---|---|
| Bitcoin | ~$76,500 | -7.3% | Broke below $77K support |
| Ethereum | ~$2,420 | -8.7% | Following BTC lower |
| Solana | ~$108 | -11.5% | Altcoins hit hardest |
| XRP | ~$0.112 | -10.4% | Giving back recent gains |
| BNB | ~$685 | -7.4% | Modest relative resilience |
Bitcoin: The $77,000 Breakdown
Bitcoin’s decline accelerated on Thursday following the PPI report, with the leading cryptocurrency falling 2% in a single session to break below $77,000.
Key Levels:
| Level | Price | Significance |
|---|---|---|
| Resistance | $80,000 | Psychological level |
| Resistance | $83,000 | Prior weekly high |
| Support | $75,000 | Next major support |
| Key Support | $72,000 | Breakdown level |
What’s Driving the Selloff:
- PPI Surprise: August PPI rose 5.4% YoY, above expectations
- Fed Hike Fears: Markets now price over 70% probability of a September hike
- Yield Surge: 10-year Treasury yield reached 4.82%, highest since November 2023
- Liquidations: $456 million in total liquidations over 24 hours, with $360 million in long positions
Ethereum: Following Bitcoin Lower
Ethereum declined nearly 9%, breaking below the $2,500 support level.
Technical Levels:
- Resistance: $2,650
- Support: $2,350
Altcoin Season Reverses
The altcoin outperformance that characterized recent weeks reversed dramatically, with high-beta names suffering the steepest declines.
Solana (SOL):
| Metric | Value |
|---|---|
| Price | ~$108 |
| Weekly Change | -11.5% |
| Key Resistance | $120 |
| Key Support | $100 |
XRP:
| Metric | Value |
|---|---|
| Price | ~$0.112 |
| Weekly Change | -10.4% |
| Key Resistance | $0.125 |
| Key Support | $0.105 |
Stablecoins: Maintaining Stability
| Coin | Price | Weekly Change | Market Cap |
|---|---|---|---|
| USDT | $1.00 | 0% | ~$183.5B |
| USDC | $1.00 | 0% | ~$73.2B |
Total Market Capitalization
- Monday Open: ~$2.78 trillion
- Friday Close: ~$2.55 trillion
- Weekly Loss: ~$230 billion
Sentiment: Greed Gives Way to Caution
The Crypto Fear & Greed Index declined sharply, falling from “extreme greed” to neutral territory.
| Metric | Value | Prior Week |
|---|---|---|
| Fear & Greed Index | 67 | 79 |
| Sentiment | Greed | Extreme Greed |
Regulatory Landscape: Continued Development
- US Congressional Developments: Stablecoin legislation continues to progress
- International: EU MiCA implementation ongoing; Hong Kong maintaining crypto hub ambitions
- Legal: Tether faces lawsuit over frozen USDT
The Week Ahead: Three Things to Watch
- Fed Meeting: The rate decision and dot plot will be critical for risk assets
- Bitcoin Support: Can $75,000 hold?
- ETF Flows: Watch for any reversal in institutional flows
Bottom Line for Crypto Investors
The crypto market’s sharp reversal underscores its sensitivity to macro conditions, particularly Fed policy expectations. The combination of hot inflation data and surging yields has removed the easy-money tailwind that supported the recent rally. A break below $75,000 could signal further downside, while a hawkish Fed outcome could extend the selling pressure.
Disclaimer
The articles, reports, reviews, and analyses provided herein (collectively, the “Content”) are for informational and educational purposes only. The Content does not constitute and shall not be construed as financial, investment, trading, legal, tax, or any other form of professional advice.
Nothing contained in these materials constitutes a solicitation, recommendation, endorsement, or offer to buy or sell any security, financial instrument, commodity, cryptocurrency, or other asset.
© 2026 Crown International Holdings. All rights reserved.