Weekly Market Roundup: Stocks, Forex, Commodities, Ags & Crypto – Full Review for Sep 14 – Sep 18, 2026

Weekly Market Roundup: Stocks, Forex, Commodities, Ags & Crypto – Full Review for Sep 14 – Sep 18, 2026
Published: September 19, 2026
Wall Street Weekly Review: Fed Hikes Into Oil Storm as Tech Defies Gravity (Sep 14 – Sep 18, 2026)

U.S. stock market analysis: Dow Jones, S&P 500, Nasdaq, and Russell 2000 performance, plus the Fed decision, oil’s relentless surge, and the AI narrative that refused to die.
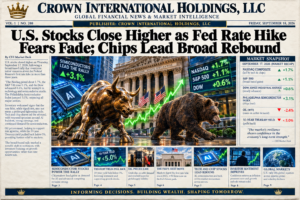
The third week of September delivered what the market had been dreading: a Federal Reserve rate hike, oil holding above $100 per barrel, and a 10-year Treasury yield touching 5% for the first time since 2007. And yet, when the closing bell rang on Friday, the damage was remarkably contained—even surprisingly absent in some corners.
This was the week that tested every bear thesis. The Fed hiked. Inflation data remained hot. Geopolitical tensions escalated. And somehow, the Nasdaq finished higher.
Major Index Performance: A Tale of Three Markets
Here’s how the four major U.S. stock indices performed for the week ending September 18, 2026:
| Index | Weekly Change | Key Takeaway |
|---|---|---|
| Dow Jones Industrial Average | -1.7% | Energy and financials dragged down the old economy |
| S&P 500 | -0.1% | Remarkable resilience given the macro backdrop |
| Nasdaq Composite | +0.7% | AI and semiconductors refused to capitulate |
| Russell 2000 | -1.2% | Small caps remain hostage to rate expectations |
The dispersion told the real story. While the Dow suffered its third consecutive weekly loss, the Nasdaq posted a gain as investors rotated out of rate-sensitive sectors and into growth names with earnings visibility. The S&P’s essentially flat finish masked significant internal turmoil—four of eleven sectors closed lower, but technology’s strength offset the weakness .
The Fed Delivers: Hawkish Hike, Unanimous Vote
The Federal Reserve raised rates 25 basis points to 3.75%-4.00% on Wednesday, the first hike since July 2023, in a unanimous 12-0 vote . The statement framed the move as supporting “a timelier return” to the 2% inflation target, noting that “inflation remains elevated” while the economy grows “at a solid pace” .
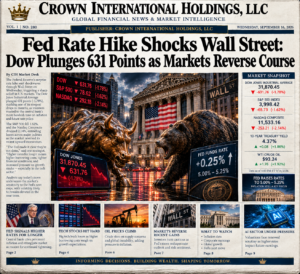
But the real fireworks came during Chair Warsh’s press conference. His hawkish tone—emphasizing that Core PCE has now run above target for 65 consecutive months, the longest streak since 1996—triggered an immediate selloff that saw the Dow drop over 600 points intraday before recovering .
The Dot Plot revealed a median expectation of one more hike this year, bringing rates to 4.00%-4.25%, with no cuts expected in 2027 . Markets, however, are pricing even more aggressively: October hike odds jumped to roughly 58% from 27% a week earlier, with futures implying approximately 3.5 additional hikes from current levels .
Oil: The $100 Floor Holds
Brent crude spent the entire week above $100 per barrel, closing Friday around $104 despite a third consecutive daily decline . The surge earlier in the week pushed prices as high as $109 as Middle East tensions escalated, but reports that Saudi Arabia would restore half of its East-West pipeline capacity within days provided some relief .
The oil story remains the market’s biggest wildcard. Higher input costs threaten corporate margins. Elevated gasoline prices squeeze consumers. And every dollar above $100 makes the Fed’s inflation fight that much harder.
The Yield Spiral
The 10-year Treasury yield touched 5.00% during the week—its highest level since 2007—before settling just below at 4.995% . The 2-year yield climbed to 4.741%, its highest close since July 2024 .
The yield surge created a brutal environment for rate-sensitive sectors. Real Estate Investment Trusts were pummeled. Utilities struggled. Housing stocks lagged. Yet technology, normally the most sensitive to rising rates, somehow found its footing—a paradox that suggests the AI trade has become a force unto itself .
Sector Performance: Semiconductors Stand Tall
| Sector | Weekly Change | Notes |
|---|---|---|
| Energy | -3.2% | Oil’s retreat from highs triggered profit-taking |
| Technology | +1.8% | Semiconductors led, shrugging off rate concerns |
| Financials | -1.5% | Hawkish Fed initially boosted banks, then reversed |
| Healthcare | -0.9% | Defensive but not immune |
| Real Estate | -2.4% | Higher yields crush REIT valuations |
| Consumer Discretionary | -1.1% | Inflation squeezes spending |
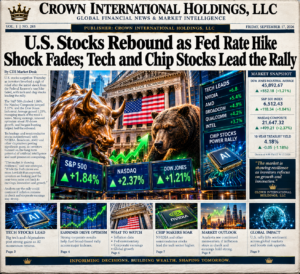
The Philadelphia Semiconductor Index gained 3.1% on Thursday alone, powered by Nvidia’s 2.5% rally after CEO Jensen Huang declared that chip sales volumes could double next year . The AI narrative, briefly shaken by Anthropic’s call for slower frontier model development, reasserted itself with a vengeance.
Final Takeaway for Investors
September was supposed to be the cruelest month. So far, it’s been merely uncomfortable. The market’s ability to absorb a Fed hike, 5% yields, and $100 oil without a broader breakdown suggests underlying resilience—or dangerous complacency.
Bullish Signals:
- Nasdaq’s resilience suggests the AI trade remains intact
- Third-quarter earnings growth estimates stand at 28.9%, the third straight quarter above 25%
- Retail sales rose 1.24% month-over-month, beating forecasts and reversing July’s weakness
Bearish Signals:
- Dow’s third consecutive weekly loss signals broad-based weakness
- October hike odds now exceed 50%, meaning the Fed isn’t done
- The 10-year at 5% is a psychological barrier that could trigger further repricing
- Oil above $100 threatens the soft-landing narrative

Weekly Forex Review: Dollar Breaks 100 as Fed Divergence Crushes Peers (Sep 14 – Sep 18, 2026)
The dollar index surges past 100 for the first time in months as the Fed’s hawkish pivot contrasts sharply with ECB easing and BoJ caution. The yen whipsaws after a “dovish hike.”
The dollar reasserted its dominance this week, surging past the 100 level on the DXY as the Fed’s hawkish hike and the contrasting dovishness of other major central banks created a perfect storm for greenback strength.
The U.S. Dollar Index closed the week at 100.26, up over 1% from the prior week’s 99.17 .
🇺🇸 U.S. Dollar (USD): The Hawkish King Returns
The greenback’s rally was driven by a simple calculus: the Fed hiked, signaled more to come, and other central banks blinked.
What Happened:
- Fed raised rates to 3.75%-4.00% with a unanimous vote
- Chair Warsh’s hawkish tone emphasized the long fight ahead on inflation
- Core PCE has now exceeded target for 65 consecutive months
- Retail sales data beat expectations, easing recession fears
The divergence couldn’t be clearer. While the Fed tightens, the ECB cuts and the BoJ moves cautiously.
🇪🇺 Euro (EUR): ECB Cuts, Euro Crumbles
The euro suffered its worst week in months after the European Central Bank unexpectedly cut rates by 25 basis points, catching markets off guard.
Weekly Snapshot:
| Metric | Value |
|---|---|
| Closing Rate (EUR/USD) | ~1.1450 |
| Weekly Change | -1.3% |
| Key Support | 1.1400 |
| Key Resistance | 1.1600 |
The cut was particularly damaging because ECB staff projections revealed something troubling: core inflation is forecast to be higher in 2027 (2.6%) than 2026 (2.5%)—an upward revision that contradicts the central bank’s easing bias . The market interpreted the cut as premature, and the euro paid the price.
🇬🇧 British Pound (GBP): Hold and Hope
Sterling held up better than the euro but still declined as the Bank of England kept rates at 3.75% while warning that Middle East tensions could stoke inflation .
Weekly Snapshot:
| Metric | Value |
|---|---|
| Closing Rate (GBP/USD) | ~1.3450 |
| Weekly Change | -0.5% |
| Key Support | 1.3350 |
| Key Resistance | 1.3600 |
The 6-3 vote revealed a committee split, with three members favoring a hike. Governor Bailey acknowledged the energy shock’s impact is “so far limited” but warned of prolonged volatility risks .
🇯🇵 Japanese Yen (JPY): The Dovish Hike Whipsaw
The yen’s week was a lesson in expectations management. The Bank of Japan raised rates 25 basis points to 1.25% as expected on Friday—but the decision was approved only 7-2, and the statement language lacked urgency about further tightening .
The result: the yen, which had strengthened earlier in the week on hawkish expectations, sold off sharply after the decision.
Weekly Snapshot:
| Metric | Value |
|---|---|
| Closing Rate (USD/JPY) | ~156.50 |
| Weekly Change | +1.8% vs. USD |
| Key Support | 154.00 |
| Key Resistance | 158.00 |
The BOJ’s caution reflects a difficult calculus: Japan’s economy remains fragile, inflation is largely imported, and premature tightening could derail the recovery.
Weekly Exchange Rate Recap
| Currency Pair | Sep 11 Close | Sep 18 Close | Weekly Change |
|---|---|---|---|
| EUR/USD | 1.1600 | 1.1450 | -1.3% |
| GBP/USD | 1.3520 | 1.3450 | -0.5% |
| USD/JPY | 153.61 | 156.50 | +1.8% |
| DXY | 99.17 | 100.26 | +1.1% |
Looking Ahead: Key Themes for FX Markets
- Fed Follow-Through: October hike odds at 58% will drive dollar direction
- ECB Credibility: Will the euro stabilize or continue its slide?
- BoJ Normalization: The cautious pace may keep yen weakness intact
- Intervention Watch: At 156, the yen approaches levels that previously triggered Japanese intervention
Bottom Line for Forex Traders
The dollar’s surge past 100 reflects a fundamental repricing of global rate differentials. The Fed isn’t just hiking—it’s signaling that the fight will continue. Meanwhile, the ECB is cutting into an inflation profile that doesn’t justify it, and the BoJ remains hesitant. Until this divergence narrows, the dollar’s path of least resistance remains higher.

Commodities Weekly Review: Oil Holds $100, Gold Retreats, Metals Diverge (Sep 14 – Sep 18, 2026)
Crude oil maintains its geopolitical premium despite late-week declines, while gold suffers as yields bite. Industrial metals face growth fears, agricultural commodities turn mixed.
Commodity markets in the third week of September were defined by one number: $100. Brent crude’s stay above that psychological threshold dominated headlines and dictated sentiment across the complex.
Crude Oil: The Geopolitical Premium Persists
Oil prices remained elevated but showed signs of fatigue by week’s end, with Brent closing around $104 after peaking near $109 .
Weekly Performance Snapshot:
| Benchmark | Price (Sep 18) | Weekly Change | Key Driver |
|---|---|---|---|
| Brent Crude | ~$104.00 | +3.5% | Geopolitical risk, supply fears |
| WTI Crude | ~$99.50 | +4.5% | Following Brent, Iran tensions |
The Escalation:
- Saudi Arabia’s East-West pipeline remains partially offline after attacks
- Ship-to-ship transfers in the Gulf of Oman surged to 2.7 million bpd from 1.5 million in August
- China reportedly asked Iran to help “rein in” Houthi attacks
Key Levels to Watch:
| Brent | WTI |
|---|---|
| Support: $100.00 | Support: $95.00 |
| Resistance: $110.00 | Resistance: $105.00 |
Gold: The Yield Squeeze
Gold suffered its worst week in over a month as the combination of a hawkish Fed, rising real yields, and dollar strength proved too much for the metal to overcome.
Weekly Performance Snapshot:
| Metal | Price (Sep 18) | Weekly Change | Notes |
|---|---|---|---|
| Gold (spot) | ~$4,276 | -2.9% | Succumbed to yield pressure |
| Gold (futures) | ~$4,290 | -3.2% | Broke below $4,300 support |
The competing forces that supported gold in prior weeks—geopolitical uncertainty, safe-haven demand—were overwhelmed by the macro picture. With the 10-year yield at 5% and the Fed signaling more hikes, gold’s lack of yield became a liability rather than an afterthought .
Key Levels:
| Level | Price | Significance |
|---|---|---|
| Support | $4,250 | Next major support |
| Support | $4,200 | Psychological level |
| Resistance | $4,350 | Former support |
| Resistance | $4,450 | 50-day MA |
Silver, Platinum, Palladium: Precious Metals Slump
| Metal | Price (Sep 18) | Weekly Change |
|---|---|---|
| Silver | ~$63.00 | -4.7% |
| Platinum | ~$1,820 | -2.7% |
| Palladium | ~$1,310 | -2.6% |
Silver’s decline was particularly severe, reflecting both gold’s weakness and industrial demand concerns .
Industrial Metals: Growth Fears Bite
Copper and other base metals suffered as global growth concerns intensified.
Weekly Performance Snapshot:
| Metal | Price (Sep 18) | Weekly Change |
|---|---|---|
| Copper | ~$6.30/lb | -6.5% |
| Cobalt | ~$42,380/t | -12.6% |
| Nickel | ~$16,800/t | -2.4% |
| Aluminum | ~$2,450/t | -2.1% |
The selloff reflected fears that aggressive Fed tightening and elevated energy costs would slow manufacturing activity globally .
Commodity Price Recap
| Commodity | Price (Sep 18) | Weekly Change | Theme |
|---|---|---|---|
| Brent Crude | ~$104.00 | +3.5% | Geopolitical premium |
| WTI Crude | ~$99.50 | +4.5% | Supply fears |
| Gold (spot) | ~$4,276 | -2.9% | Yield pressure |
| Silver | ~$63.00 | -4.7% | Industrial + precious weakness |
| Copper | ~$6.30/lb | -6.5% | Growth concerns |
The Week Ahead: Three Things to Watch
- OPEC+ Response: Will producers react to sustained $100+ oil?
- Dollar Direction: A stronger dollar pressures all commodities
- China Data: Industrial production and retail sales could move base metals
Bottom Line for Commodities Investors
The oil market remains hostage to geopolitics, with the risk premium unlikely to fade until Middle East tensions ease. Gold’s struggle reflects the difficult environment for non-yielding assets when real rates are rising. Industrial metals face a more fundamental problem: the global growth outlook is deteriorating just as supply constraints were supposed to support prices.

Grains & Livestock Weekly Review: Corn and Wheat Retreat, Soybeans Hold, Cattle Under Pressure (Sep 14 – Sep 18, 2026)
Grains face harvest pressure and a stronger dollar. Wheat gives back recent gains. Cattle markets struggle with feed costs and demand uncertainty.
Agricultural markets traded mostly lower this week, pressured by the approaching harvest, a resurgent dollar, and profit-taking after recent rallies.
Corn: Harvest Pressure Dominates
Corn futures declined as seasonal selling pressure emerged with the harvest underway.
Weekly Performance Snapshot:
| Benchmark | Sep 11 Price | Sep 18 Price | Weekly Change |
|---|---|---|---|
| CBOT Corn | $5.28/bushel | $5.18/bushel | -1.9% |
Market Dynamics:
Bearish Factors:
- Harvest progressing, creating seasonal selling pressure
- Stronger dollar reduces U.S. export competitiveness
- Technical selling after recent rally
Bullish Factors:
- USDA cut U.S. corn crop forecast by 5.4 Mt to 401.3 Mt due to hot weather
- Strong export demand
- Lower crop condition ratings
Key Levels:
| Level | Price |
|---|---|
| Support | $5.10 |
| Resistance | $5.35 |
Soybeans: Relative Resilience
Soybeans held up better than corn, supported by strong crush demand and South American planting concerns.
Weekly Performance Snapshot:
| Benchmark | Sep 11 Price | Sep 18 Price | Weekly Change |
|---|---|---|---|
| CBOT Soybeans | $12.62/bushel | $12.55/bushel | -0.6% |
What’s Driving the Market:
Bearish Factors:
- Record Brazilian production expected
- Harvest pressure approaching
- Stronger dollar
Bullish Factors:
- Strong domestic crush demand
- South American planting weather concerns
- U.S. soybean stocks remain tight
Wheat: Giving Back Gains
Wheat futures retreated after last week’s surge, pressured by profit-taking and a stronger dollar.
Weekly Performance Snapshot:
| Benchmark | Sep 11 Price | Sep 18 Price | Weekly Change |
|---|---|---|---|
| CBOT Wheat | $6.08/bushel | $5.95/bushel | -2.1% |
Market Context:
- Black Sea shipping uncertainty persists
- Russia’s wheat export forecast cut by 3.2 Mt to 41.4 Mt
- Global wheat stocks revised higher due to Australian and Canadian crops
Cattle & Calves: Under Pressure
Cattle markets declined as elevated feed costs and processing margin pressure weighed on prices.
Weekly Performance Snapshot:
| Benchmark | Price (Sep 18) | Weekly Change | Notes |
|---|---|---|---|
| Live Cattle (Oct) | ~$2.15/lb | -1.8% | Testing support |
| Feeder Cattle | ~$323.50 | -1.8% | Feed cost pressure |
Key Levels:
- Live Cattle Support: $2.10/lb
- Live Cattle Resistance: $2.20/lb
Agricultural Price Recap
| Commodity | Price (Sep 18) | Weekly Change |
|---|---|---|
| Corn | $5.18/bushel | -1.9% |
| Soybeans | $12.55/bushel | -0.6% |
| Wheat | $5.95/bushel | -2.1% |
| Live Cattle | ~$2.15/lb | -1.8% |
The Week Ahead: Three Things to Watch
- Harvest Progress: Early yield reports will shape price direction
- USDA Reports: Weekly export sales and crop progress data
- South American Weather: Planting season conditions in Brazil and Argentina
Bottom Line for Ag Investors
Grains are entering the heart of harvest season with prices under pressure from seasonal selling and a resurgent dollar. Wheat’s pullback after recent gains suggests the market is consolidating rather than reversing. Livestock markets face a challenging environment with elevated feed costs and uncertain demand.

Crypto Weekly Review: Bitcoin Reclaims $80,000 as Fed Fears Fade, ETFs Rotate (Sep 14 – Sep 18, 2026)
The crypto market stages a remarkable recovery from early-week weakness, with Bitcoin surging past $80,000 on Friday as the Fed decision removes uncertainty and ETF flows rotate from BTC to ETH.
The cryptocurrency market’s sharp reversal from last week’s selloff was complete by Friday, with Bitcoin breaking back above $80,000 and altcoins posting solid gains. The week began with caution ahead of the Fed decision but ended with renewed optimism.
Weekly Performance Summary
| Asset | Price (Sep 18) | Weekly Change | Notes |
|---|---|---|---|
| Bitcoin | ~$81,200 | +6.1% | Reclaimed $80K on Friday |
| Ethereum | ~$2,580 | +6.6% | ETF inflows support |
| Solana | ~$115 | +6.5% | Altcoins recovered |
| XRP | ~$1.40 | +8.5% | Led major alts |
| BNB | ~$715 | +4.4% | Steady recovery |
Bitcoin: The $80,000 Reclaim
Bitcoin’s week was a tale of two halves. Monday saw BTC trading near $78,000 amid AI concerns and Fed anxiety. By Friday, the largest cryptocurrency had surged above $81,000, buoyed by the Fed decision’s removal of uncertainty and a broader risk-on shift .
Key Levels:
| Level | Price | Significance |
|---|---|---|
| Resistance | $83,600 | Next major resistance |
| Resistance | $81,700 | 365-day MA (key confirmation level) |
| Support | $78,000 | Near-term support |
| Support | $75,426 | Heaviest cost-basis concentration |
Long-term holders have provided crucial support. Net position change among this cohort reversed from -20,182 BTC/day on August 28 to +20,843 BTC/day by September 13, even as spot pulled back . The message: holders are accumulating at these levels, not capitulating.
Ethereum: ETF Flows Rotate
Ethereum outperformed Bitcoin this week, supported by a notable rotation in ETF flows. While U.S. spot Bitcoin ETFs saw $463 million in outflows over four sessions, spot Ether ETFs attracted $197 million—a genuine rotation between the two largest assets .
Technical Levels:
- Resistance: $2,650
- Support: $2,450
Altcoin Recovery
The altcoin complex staged a broad recovery, with XRP leading major tokens.
Solana (SOL):
| Metric | Value |
|---|---|
| Price | ~$115 |
| Weekly Change | +6.5% |
| Key Resistance | $120 |
| Key Support | $105 |
XRP:
| Metric | Value |
|---|---|
| Price | ~$1.40 |
| Weekly Change | +8.5% |
| Key Resistance | $1.50 |
| Key Support | $1.25 |
Stablecoins: Steady Growth
| Coin | Price | Weekly Change | Market Cap |
|---|---|---|---|
| USDT | $1.00 | 0% | ~$184B |
| USDC | $1.00 | 0% | ~$74B |
Coinbase announced a partnership with Moov to bring stablecoin payments to over 1,000 community banks and credit unions, a significant step toward mainstream adoption .
Total Market Capitalization
- Monday Open: ~$2.55 trillion
- Friday Close: ~$2.72 trillion
- Weekly Gain: ~$170 billion
Sentiment: Fear Gives Way to Greed
The Crypto Fear & Greed Index recovered from last week’s decline, climbing back toward “Greed” territory as the Fed decision removed a major overhang.
| Metric | Value | Prior Week |
|---|---|---|
| Fear & Greed Index | 72 | 67 |
| Sentiment | Greed | Neutral |
Regulatory Landscape: Progress Continues
- US Congressional Developments: The Clarity Act advanced to a procedural Senate vote, with prediction markets pricing roughly 30% odds of passage this year
- Bitcoin Reserve Bill: A House panel advanced legislation for a strategic Bitcoin reserve
- Canada: OSFI clarified that tokenized bank deposits are legally equivalent to traditional deposits
- Japan: Metaplanet shareholders forced a 41% cut in executive options, improving BTC-per-diluted-share by 8.8%
The Week Ahead: Three Things to Watch
- $81,700 Resistance: A breakout above this level—the 365-day MA—would confirm a new bull cycle
- ETF Flows: Watch whether the BTC-to-ETH rotation continues
- Clarity Act Vote: A successful Senate vote would provide regulatory tailwinds
Bottom Line for Crypto Investors
The crypto market’s recovery from last week’s PPI shock demonstrates its resilience and the strength of underlying holder conviction. Bitcoin’s return above $80,000, combined with the rotation into Ethereum ETFs and progress on regulatory clarity, suggests the bull market remains intact. The key test lies ahead: $81,700, the 365-day moving average that would confirm a new cycle .
Disclaimer
The articles, reports, reviews, and analyses provided herein (collectively, the “Content”) are for informational and educational purposes only. The Content does not constitute and shall not be construed as financial, investment, trading, legal, tax, or any other form of professional advice.
Nothing contained in these materials constitutes a solicitation, recommendation, endorsement, or offer to buy or sell any security, financial instrument, commodity, cryptocurrency, or other asset.
© 2026 Crown International Holdings. All rights reserved.